The stock market is declining or recovering from weekly declines more than 80% of the time. By minimizing those drawdowns, Vital Risk Control™ more than doubles annual returns.
In the world of investing, we are often taught to keep our eyes on the prize: the upside. We celebrate the "green days" and study the charts of historic bull runs. But as any seasoned Quantitative Strategist will tell you, the secret to long-term wealth isn't just about how much you make when the sun is shining—it’s about how little you lose when the storm hits.
At VitalQuant, we look at the numbers differently; we start by addressing the risk inherent in any stock universe on which a strategy draws. Consider a sobering reality of the S&P 500: the index spends roughly 80% of its time either in a weekly decline or in the long, arduous process of recovering from one (per independent, third-party analysis).
For the retail investor, the “80% Problem” creates a “treadmill effect” where you are constantly working to get back to even. Surely, many investors feel like Sisyphus from Greek mythology, always pushing that rock back up the investment mountain, again and again, just to watch it roll back down.

A perfect example is the 2007-2009 Global Financial Crisis, when the S&P 500 dropped by -55% in 18 months. Then it required a gain of 136% over four long years just to get back to breakeven. Only after those four, long drawn-out years could the average buy-and-hold investor begin making money again.
And please don't kid yourself that you would have exited at the right time and would have avoided all the drawdowns that accompany a buy-and-hold approach.
A perfect example is the 2007-2009 Global Financial Crisis, when the S&P 500 dropped by -55% in 18 months. Then it required a gain of 136% over four long years to get back to breakeven. Only after those four, long drawn-out years could the average buy-and-hold investor begin making money again.
And please don't kid yourself that you would have exited at the right time and would have avoided all the drawdowns that accompany buy-and-hold.
It's easy to say in hindsight that you would have timed it right. But according to Dalbar, Inc., which has documented the returns of individual investors every year since 1985, the average investor underperforms the S&P 500 by one-third. This occurs because these investors naturally believe they can do better than the market, ponder all the possibilities they can conceive, and make discretionary decisions based on hope for gain and fear of loss. For this reason, discretionary investors tend to buy high (after the market has been rising) and sell low (after a period of decline).
As a result, the average annual return for the S&P 500 (SPY) since the 1990s is 10.4%, and the average retail investor only gains an average of 6.9% per year, according to Dalbar. Even the pros can't beat buying-and-holding the S&P 500. Roughly 80% to 90% of actively managed mutual funds fail to beat their benchmark according to Morningstar analysts.
To break this cycle and significantly increase the returns of systematic investment strategies, we developed Vital Risk Control™, a patent-pending technology designed to do what human management cannot: systematically arrest declines before they erode your hard-earned capital.
No judgment on your part is required. In fact, your judgment should be avoided if you wish to benefit from the profound advantages of systematic investing. All you need do is follow the weekly signals from the systematic strategies on Monday mornings. But don't be concerned that we advocate for unrestrained, rapid-fire weekly trading. The VitalQuant strategies have an average position hold time of 1.1 to 4.3 months, depending on the model.
Our Vital Risk Control™ technology has been characterized as VitalQuant's 'superpower' because of how much it enhances returns and provides client satisfaction. Vital Risk Control™ (VRC) is not a simple "stop-loss," a "moving-average crossover," or a rigid rule-of-thumb. It is a model-integrated risk system that acts as a sophisticated circuit breaker for your portfolio.
By utilizing a composite of diverse signals—ranging from macroeconomic data and market breadth signals to asymmetric friction filters and dynamic volatility-adjusted support and resistance levels—the VRC system determines when the "mathematical weather" has turned hazardous. That hazard signal may be triggered by an individual position or by the overall market, and the strategy will make the appropriate adjustments to avoid loss.
What makes this technology truly unique is its use of Digital Signal Processing to customize trades for specific market segments. The VRC system recognizes that the price patterns of a tech-heavy strategy behave differently than those of a value-based model, and large-cap stocks perform differently than small-cap stocks. Stock and ETF-based portfolios also behave very differently from one another. By adapting to these and other nuances, Vital Risk Control™ provides a reliable way to reduce exposure exactly when the risk-to-reward ratio flips against you.
Vital Risk Control™ also integrates a physics-inspired friction model to equity price action. It introduces a dynamic noise threshold from recent market volatility, and prices must generate enough force to overcome the price-friction threshold for a direction change to be signaled. The result is phenomenal accuracy that blocks out meaningless market noise and accurately identifies trend changes.
If you've been around investing for a few years, you've likely heard the phrase "Time in the market beats timing the market.'" That principle made sense when sophisticated risk management wasn't available to individual investors — but it also conveniently served an immense industry that got paid to hold assets, not optimize performance - i.e., mutual funds.
A shocking fact that this $32 trillion industry doesn't want you to know is that 80% to 90% of mutual funds underperform their benchmarks (Google it!). So the industry pushed a great deal of false buy-and-hold propaganda on investors in the last 100 years to keep their client's money as long as possible, despite their lousy track record.
However, neither the mutual funds nor their clients had the benefit of sophisticated, evidence-based mathematical systems to help them avoid significant drawdowns and double returns. Today, that drawdown mitigation and profoundly improved portfolio performance is available to you with the VitalQuant systematic Premium Strategies that each use our Vital Risk Control™ to cap drawdowns.
Why do we put so much effort put into mitigating drawdowns? Why is VitalQuant a "risk-control-first" strategy designer and manager? Because the math of a drawdown is unforgiving. If your portfolio drops -20%, you need a 25% gain just to get back to zero. If it drops -50%, you need a staggering 100% gain to recover.
But what if you didn't have to experience those devastating drawdowns? What if the worst drawdown you experience averages around only -15%?
By significantly truncating (or shortening)—those decline periods, VitalQuant strategies allow your money to spend more time in the "growth phase" and less time in the "decline-and-recovery phase." If you lose less when the market is declining, your gains compound from a much higher base. Plus, VRC gets you back into the market at the perfect time after a steep market decline, a time when most investors are in shell shock and won't touch a trade. That expands the amount of time when Vital Risk Control™ isn't just a defensive asset; it is a powerful performance multiplier.
The best way to demonstrate the power of our Vital Risk Control™ technology is to show you its effect in a situation that millions of investors experienced over the last 25 years. For this simple example, Image 1 below shows a typical scenario where an individual investor buys-and-holds the S&P 500 ETF (SPY) from January 1, 2000 to December 31, 2025 – a quarter-century of holding an index fund of the 500 largest US companies. No expert-designed quant strategy involved here... just the S&P 500 Index.
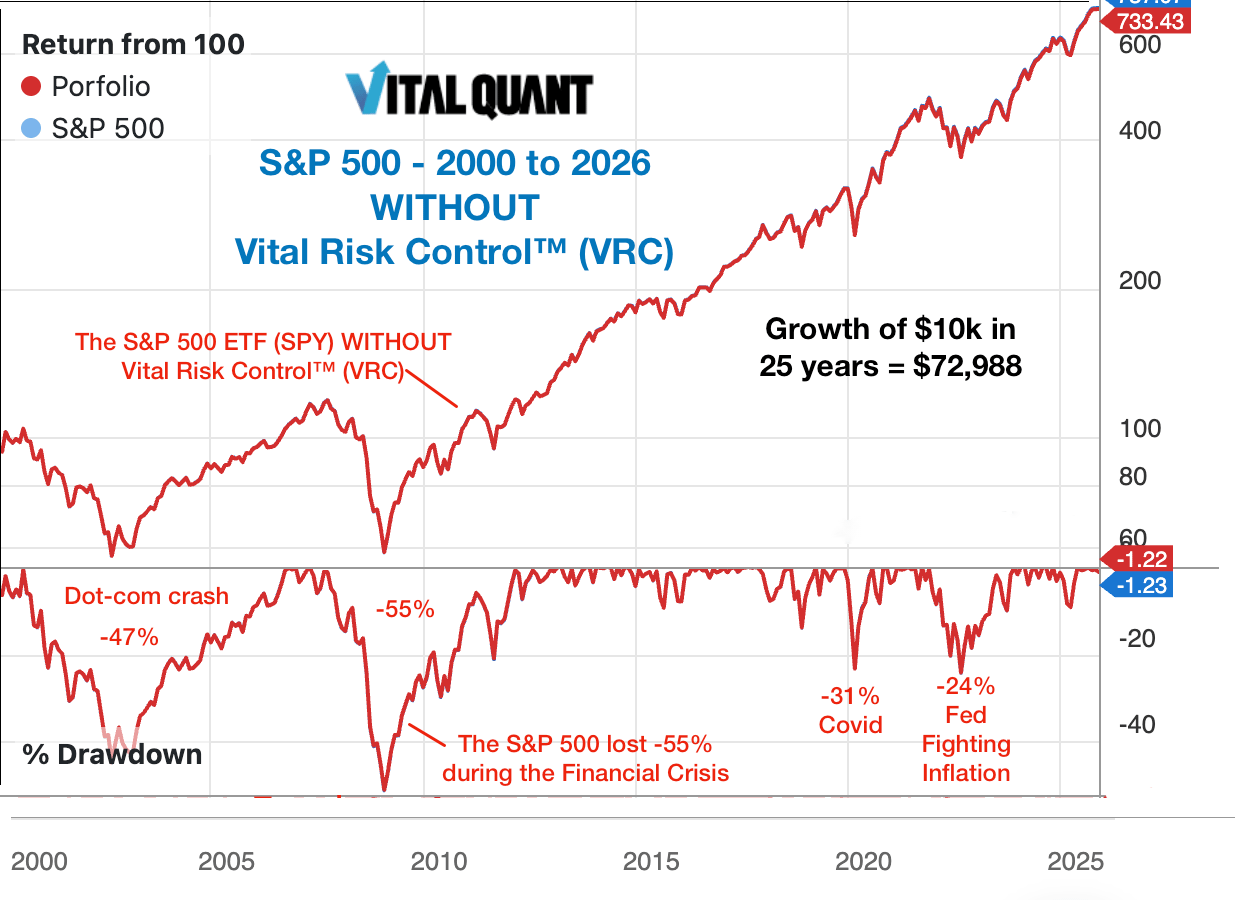
Image 1 above illustrates the performance of the S&P 500 ETF (SPY) as a buy-and-hold investment over a 25-year period. During this time, SPY appreciated by 637%, meaning that a $10,000 investment made in January 2000 would grow to $72,988 by the end of December 2025. While these figures sound reasonable, it's crucial to recognize the underlying realities.
Many investors who poured their retirement savings into SPY or similar index ETFs during this period experienced severe pain during four major market downturns, with losses of -47%, -55%, -34%, and -24%, for the dot-com crash, GFC, Covid pandemic, and inflation-fighting-Fed interest rates, respectively. These losses are depicted in the lower window of Image 1, above. Just think about the emotional toll of planning for retirement while witnessing your S&P 500 ETF investment—and your hard-earned savings—plummet by a quarter, a third, or even more than half! It would be nothing short of devastating (and some of you reading this lived through it).
However, this sobering scenario can be drastically transformed by harnessing the power of a VitalQuant Premium Strategy that uses Vital Risk Control™.
Let’s dive into the remarkable benefits that you get when we apply Vital Risk Control™ technology to the S&P 500 Index ETF (SPY) over the same 25-year period. The benchmark SPY ETF is shown in blue, and the Vital Risk Control™-managed version in red. The lower window shows how the drawdowns are minimized in red:
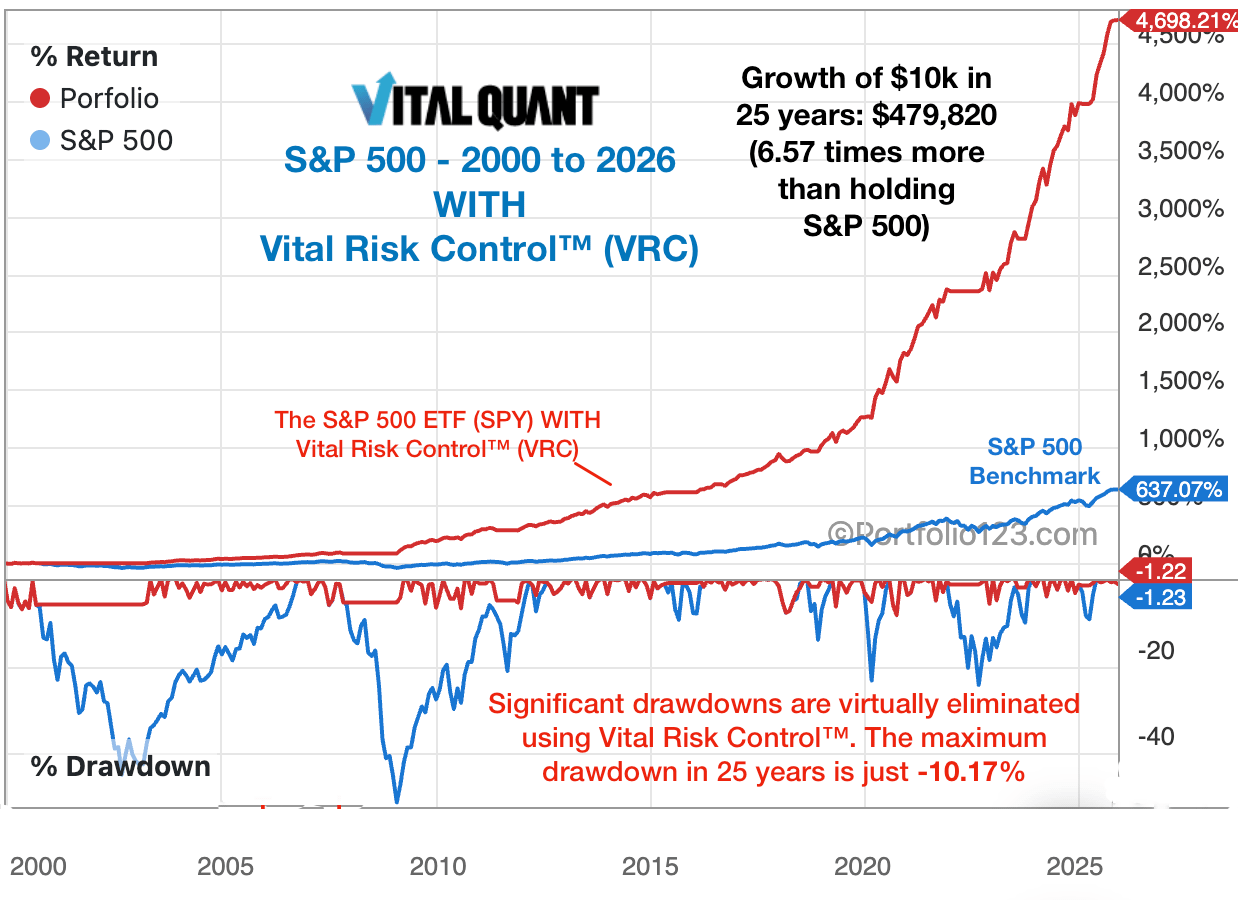
Image 2 shows the "WITH VRC" chart (above), which is very different from the "Buy-and-Hold" chart shown in Image 1. The "WITH" chart shows that a $10,000 investment in the S&P 500 ETF in January 2000 would grow to $479,820 by the end of December 2025. That's a total return of 4,698% — nearly seven times the return of SPY over that same 25-year span, with an average of less than one (0.72) trade per year. Moreover, adding VRC doubles the annual return of buying and holding the S&P 500, taking the average performance from 7.94% to 15.98% each year.
Beyond the spreadsheets, there is a human element to risk. Large drawdowns are the primary reason retail investors abandon even the best-performing strategies. It can be difficult to stay disciplined even in the best of times, but it is agonizing to watch a portfolio bleed value in real-time. This "emotional tax" leads to panic-selling near the bottom and missed opportunities on the way up. Our natural instincts for "fight or flight" kick in, and we are done. Even the most experienced investor can succumb to the harrowing impact of a volatile market.
Vital Risk Control™ removes the burden of these difficult, high-stress decisions. By automating the reduction of exposure during unfavorable conditions, it provides a "welcome respite" from the anxiety of market volatility. Our subscribers don't have to guess when to move to the sidelines; the system does it for them, based on objective, multi-factor data.
The average annual maximum drawdown (AAMDD) of the VitalQuant strategies is just -11.15%. In other words, that's been the average worst decline each year for all the strategies. While there may be occasional worse declines in the future, most investors find that level of temporary, short-term loss easily tolerated. After all, a -10% to -15% drawdown is typical of market noise, and is usually very short-lived.
At VitalQuant, we believe that a superior investment strategy should deliver two things: exceptional performance and stress-free nights. By integrating Vital Risk Control™ into our algorithmic models, we’ve shifted the focus from merely "beating the market" to "mastering the math of the market."
By protecting your downside, we don't just protect your money—we protect your peace of mind and your ability to stay the course. That is the true power of systematic risk reduction and rules-based investing.
Important Disclosures: For informational purposes only to demonstrate the effectiveness of systematic investment strategies. VitalQuant does not offer personalized investment advice. Neither Vital Quantitative Research, LLC (dba VitalQuant.com), nor its employees, service providers, associates, or affiliates are responsible for any losses you may incur as a result of using the information provided. Investing in publicly traded securities is inherently risky, and you may lose money. Past investment performance may not be indicative of future returns. All quantitative strategies developed by any provider must use simulated or hypothetical performance results in their creation, which have inherent limitations and do not represent actual trading. All VitalQuant Premium Strategies must have a minimum of five years of out-of-sample, live performance to be considered for our lineup of flagship investment strategies. The content herein may not be copied, reproduced, or distributed in any way. See all Terms and Conditions for use of this website.
VitalQuant provides individual investors with high-performance, institutional-grade investment strategy signals at an affordable price. Profit from models designed by Wall Street strategists today.
.svg)
.svg)
.svg)
.svg)