
 Vital Secrets Blog
Quantitative Methodology · Risk Management
Risk Identification, Not Market Timing
The thinking behind Vital Risk Control—and why a regime overlay built to recognize danger tends to survive out-of-sample when direction-calling doesn't.
Ask any serious quantitative investor whether market timing works and you will get a well-earned skeptical answer. Most timing systems are exercises in curve-fitting: someone optimizes a set of entry and exit parameters against a specific slice of history, the backtest looks spectacular, and the whole thing quietly falls apart the moment it meets live data it has never seen. The skepticism is correct. It is also aimed at the wrong target.
There is a distinction hiding inside the question, and it is the distinction on which Vital Risk Control™ (VRC) is built. Market timing tries to call direction—to get you long at the bottom and short at the top. Risk identification is a narrower and more honest task. It does not predict that the market will fall. It recognizes when the distribution of outcomes has changed—when the left tail has quietly grown fatter—and adjusts exposure accordingly.
We are not in the business of predicting the next crash. We are in the business of recognizing when the environment has shifted from one that rewards risk to one that punishes it.
That is a more modest claim than "we can time the market," and modest claims are the ones that hold up. A system that tries to identify heightened risk can afford to be wrong about direction and still add value, because its job is to tell you when not to be adding risk—not to guess the exact turning point. VRC is that kind of system: a regime-level overlay that sits above every VitalQuant strategy and governs how much risk each one is permitted to carry at a given moment.
Provenance
Where VRC came from
VRC was not reverse-engineered from a backtest. It grew out of a specific and painful market event—the quantitative disruption of 2006—and was hardened through the 2007–2009 financial crisis, when the difference between a strategy that steps aside and one that does not was measured in whole years of recovery. Nearly four decades of experience across investment banking, hedge funds, and money management went into deciding which signals to trust and, just as importantly, which to ignore.
That provenance matters because it explains a design choice that separates VRC from most timing tools: it does not rely on any single indicator. A lone signal—however elegant—is fragile. It fires on noise, it decays as markets adapt, and it invites exactly the curve-fitting that dooms timing systems. VRC instead blends several independent, structurally-grounded measures into a single risk state. Two of those measures are worth explaining in detail, because they illustrate why the approach works rather than merely asserting that it does.
Signal One
Credit spreads
Credit spreads are, in my experience, the single most reliable class of risk indicator available—and the reason is mechanical, not mystical. It is not that bond investors are smarter than equity investors.
Corporate debt is a senior claim with capped upside. A bondholder's entire return depends on avoiding the bad outcome, so the price of a corporate bond is dominated by downside underwriting—the market's assessment of default risk. Equity is the junior, convex claim on the very same company assets. When the outlook for those assets deteriorates, it shows up as a small repricing in the bond and a large one in the stock. Credit is measuring the shared input with far less noise than equity prices carry.
Several spreads say different things, and VRC pays attention to more than one:
- The quality spread within investment grade (BBB versus AAA). Because both legs are corporate bonds, this comparison strips out the Treasury and interest-rate component and isolates one thing: how much extra the market is demanding to step down in credit quality. When that gap widens, risk appetite is contracting—independent of what rates are doing.
- High yield versus Treasuries. This is the more sensitive gauge. Junk debt is where marginal risk appetite shows up first, and looking at high yield relative to comparable-maturity Treasuries reveals the pure credit-risk premium—the compensation investors demand for owning the riskiest corporate paper.
Two disciplines separate a useful credit signal from a source of false alarms. First, the level is nearly useless as a trigger. Spreads are highly persistent; they can sit tight for years. It is the rate of change—and where a move ranks against its own recent history—that carries the information. Second, composition matters. The 2015–2016 spread blowout was concentrated in energy and commodity issuers after oil collapsed. It looked alarming in the headline series but never generalized to broad corporate solvency, and equities recovered. A widening driven by one sector is not the same signal as one that spans the whole market. VRC is built to tell the difference.
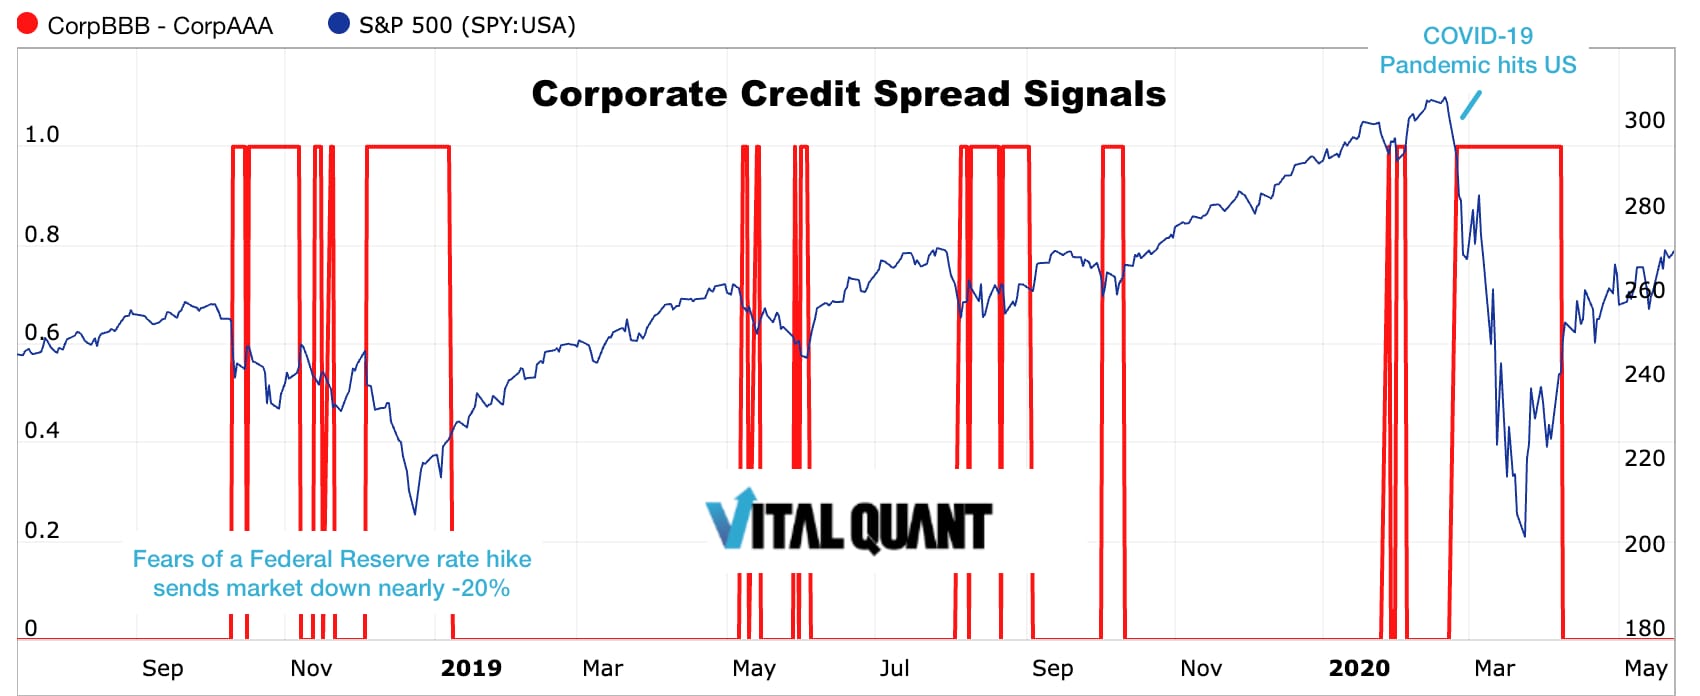
Corporate Credit Spread Signals. The BBB−AAA quality spread plotted against the S&P 500 (blue), Sept 2018–May 2020. Each red band marks a risk-off signal generated as the spread widened.
The chart above spans two of the most instructive episodes of the last several years. In late 2018, persistent hawkish commentary from then–Federal Reserve Chair Jerome Powell stoked fears of aggressive rate hikes and drove the S&P 500 down nearly 20% into year-end. Barely a year later, the onset of nationwide COVID-19 social-distancing measures triggered one of the fastest equity collapses in market history. In both cases the quality spread widened and issued its risk-off signals before the steepest part of the decline—exactly what you want from an indicator that reads the left tail directly. This is one of three distinct credit-spread setups feeding the VRC risk assessment.
Signal Two
Market breadth
The second structurally-grounded warning is breadth deterioration, and the logic is intuitive once stated: major market tops are almost always preceded by a shrinking group of stocks carrying the index.
The averages make new highs while participation quietly narrows beneath the surface. Fewer and fewer names are actually advancing; the index looks healthy only because a handful of large constituents are masking widespread weakness underneath. The measures that capture this diverge from the index before it rolls over, because the selling begins in individual stocks well before it reaches the cap-weighted headline number. Among the breadth indicators VRC monitors:
- The percentage of stocks trading above their 200-day moving average—a direct read on how broadly the primary trend is being participated in.
- Net new highs versus new lows—a gauge of leadership quality, and of whether strength is genuine or increasingly hollow.
- The McClellan Summation Index—an intermediate-term measure of the breadth trend itself, which smooths daily noise into a picture of whether participation is building or eroding.
You very rarely get a serious decline without breadth deteriorating first. The important honesty here—and it is the same honesty that applies to spreads—is that the reverse is not true: you can get breadth deterioration that never resolves into a real drawdown. That is precisely why no single measure is trusted on its own.

% Above 200-day SMA Breadth Signals. The share of stocks trading above their 200-day moving average, plotted against the S&P 500 (blue), Oct 2018–May 2020.
Across the same two declines, participation collapsed as the selling took hold, and this measure flagged risk-off in step with the credit signals. But its most valuable contribution came on the other side. Getting out is only half the problem; the harder half is knowing when it is safe to get back in. After both the 2018–19 and 2020 declines, many investors sat frozen in cash well past the bottom, unsure whether conditions had truly normalized. VRC's re-entry signals fired as breadth rebuilt, redeploying into the recovery at opportunistic prices rather than waiting for the all-clear that only arrives long after the low. These re-entry signals are among the most valuable features of the system, precisely because the moment of greatest uncertainty for a human investor—the aftermath of a crash—is exactly when a disciplined, rules-based read on participation is worth the most. VRC uses three separate “percent above” measures alongside additional breadth signals.
Two signals of ten. Credit spreads and market breadth are just two of the ten components in the VRC market-risk assessment. Because each component contributes a variable reading rather than a simple on/off vote, the system produces a graduated risk level—which is what allows VitalQuant strategies to scale into and out of the market in proportion to how much risk is actually present, rather than lurching all-or-nothing between fully invested and fully in cash.
The Composite
Why the blend is the point
This is the crux of the argument against the curve-fitting critique. Each of these measures—credit spreads, breadth, and the additional signals in the system—is a confirming and conditioning variable, not a standalone trigger. Each will, in isolation, fire on episodes that resolve without a real decline. Any one of them alone will whipsaw you.
Their value emerges in combination and in what they are allowed to do. VRC does not use these signals to flip a strategy short. It uses them to decide when to reduce gross exposure, tighten position sizing, or simply stop adding new risk—the "avoid going long" case rather than the "go short" bet. Framed that way, as a regime state that scales exposure rather than a signal that reverses it, the approach asks far less of the data than direction-calling does, which is exactly why it has held up across market environments the system was never fitted to.
The distinction in one line: A timing system tries to be right about where the market is going. A risk-identification overlay only needs to be right about when the odds have turned against you—and then get out of the way of your strategy the rest of the time.
In Practice
How VRC fits the strategies
Every VitalQuant strategy runs beneath the same Vital Risk Control™ overlay. It operates at the regime level, entirely separate from the position-level rules that govern individual holdings. The stock-selection engine does what it does best in normal environments; VRC's job is to recognize the rarer, more dangerous ones and dial risk down before the damage is done, then step aside and let the strategy compound when the environment turns constructive again.
That division of labor—disciplined selection when conditions are healthy, systematic risk reduction when they are not—is the whole philosophy. Not prediction. Not heroics. Just the consistent, rules-based recognition of when risk has quietly become expensive.
© Vital Quantitative Research, LLC · For informational purposes only. Past performance is not indicative of future results. · Return to Blog Index
Important Disclosures: This article is educational commentary on quantitative methodology and is provided for informational purposes only. VitalQuant does not offer personalized investment advice, and nothing herein constitutes a recommendation to buy or sell any security. Neither Vital Quantitative Research, LLC (dba VitalQuant.com), nor its employees, service providers, associates, or affiliates are responsible for any losses you may incur as a result of using the information provided. Investing in publicly traded securities is inherently risky, and you may lose money. Past investment performance may not be indicative of future returns. Vital Risk Control™ is a proprietary system of VitalQuant. The content herein may not be copied, reproduced, or distributed in any way. See all Terms and Conditions for use of this website.

.svg)
.svg)
.svg)