
VitalQuant recruits Strategy Designers from respected Wall Street investment firms (these companies have not endorsed VitalQuant):


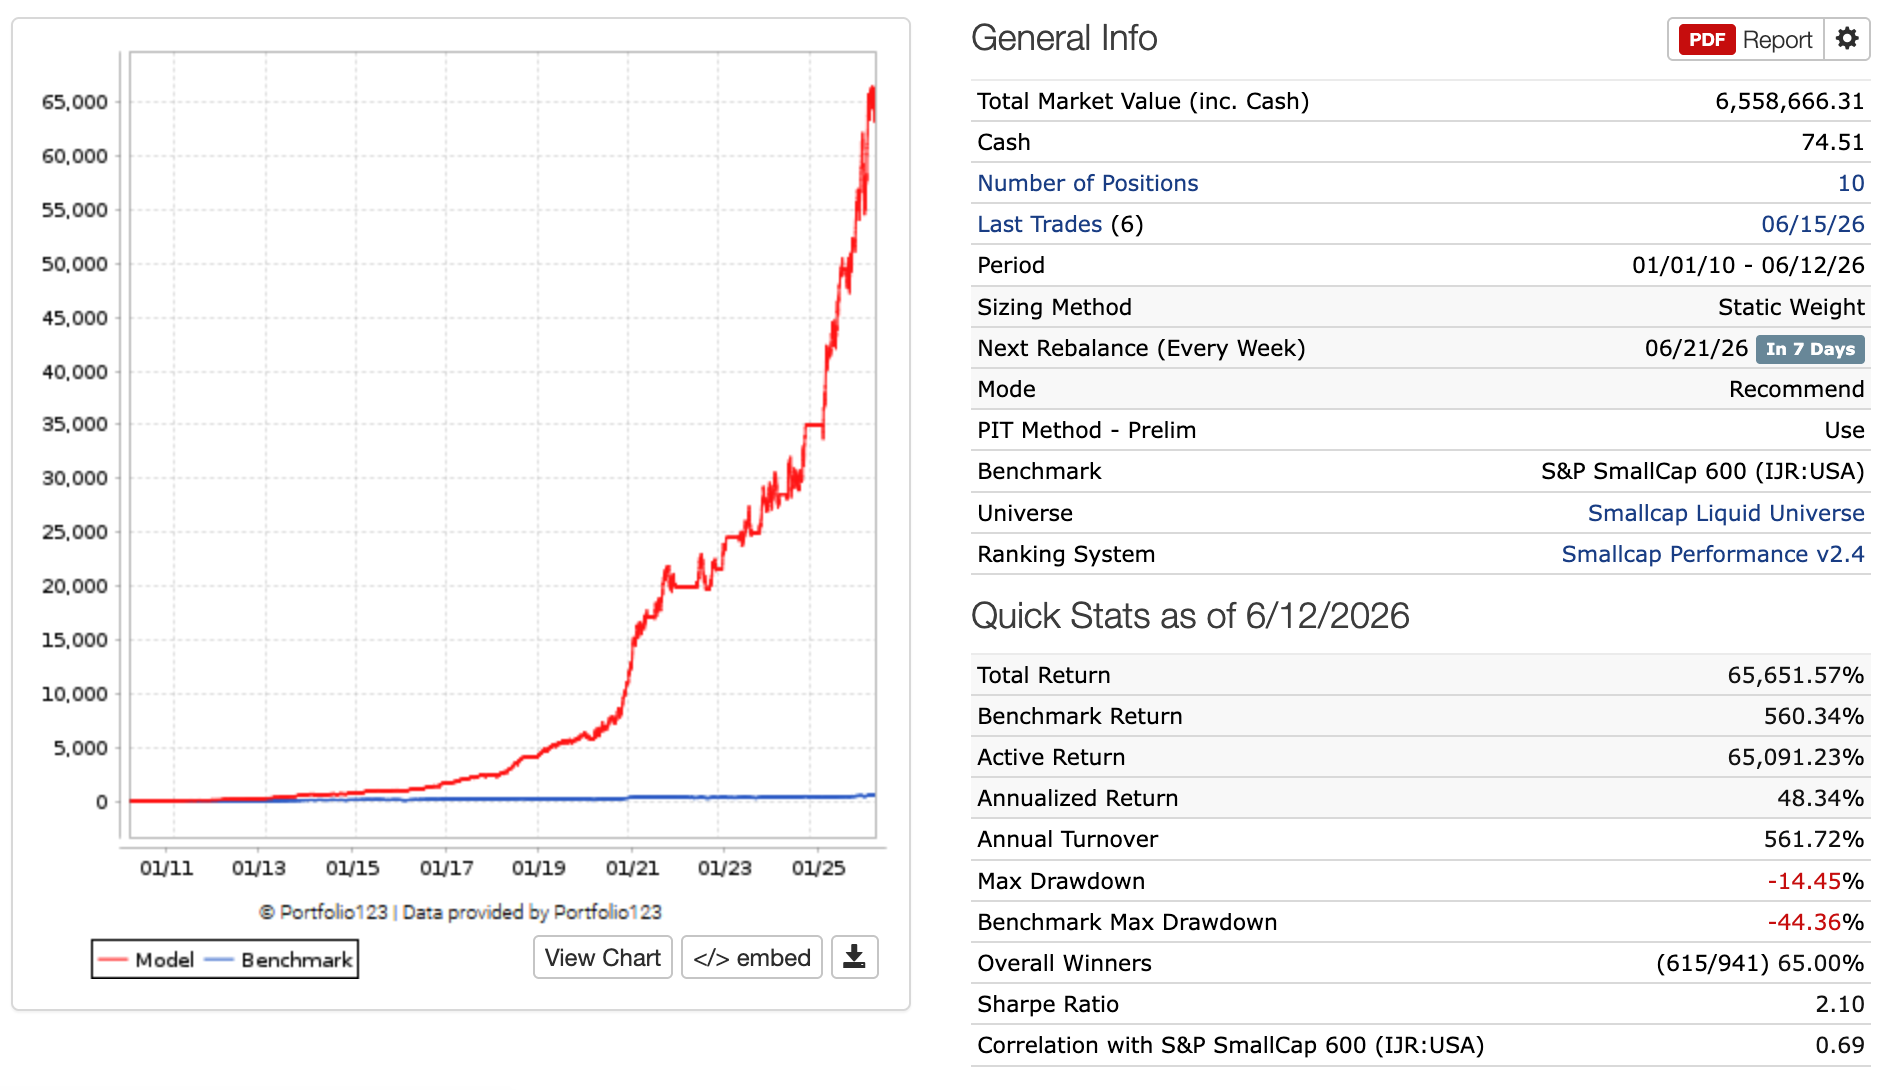
The VitalQuant Smallcap Winners Strategy uses a precision-engineered ranking system and proprietary Buy/Sell Rules designed to capture the explosive growth of the market’s most promising small companies. By targeting the top five highest-ranked equities within the $300 million to $2 billion market capitalization range, this strategy bridges the gap between high-reward microcaps and stable, established mid-caps, producing a return of 45%+ with a max drawdown of only -14%.
This isn't just about finding "good" small companies; it’s about identifying "winners" that possess institutional-grade fundamental strength and an undervalued price with bottled-up momentum. When that momentum is unleashed, the stock climbs at a pace far outperforming the market.
Smallcap investing is often seen as a "wild west" of volatility. VitalQuant has tamed that frontier. While the average smallcap index is prone to gut-wrenching swings, our data-driven approach with Vital Risk Control™ technology has established a level of stability that is frankly unheard of in the smallcap segment of the market.
Velocity Meets Precision
Most "buy and hold" strategies leave your capital locked up for far too long, often hoping to recover from inevitable declines. We prefer approaches with reasonable turnover. With an average hold time of 52 days (2.5 months), your capital stays productive, rotating from one market segment uptrend to the next. Because 65% of trades are winners, the strategy builds a compounding "snowball effect" that fuels long-term wealth without the decades-long wait times.
Putting Vital Risk Control™ to Effective Use
Small-cap stocks often exhibit higher volatility compared to large-cap stocks or ETFs, which is why our Vital Risk Control™ (VRC) technology shines in small-cap stock strategies.
By fine-tuning the VRC settings to match the specific characteristics of each strategy, the algorithms can monitor volatility, track drawdowns, and assess various breadth measures of the equity curve. This proactive approach enables our system to strategically exit or hedge positions as needed. The outcome? Remarkably minimal drawdowns that not only enhance returns but also alleviate investor stress and instills confidence.
The Performance by the Numbers
Since 2010, the Smallcap Winners strategy hasn't just beaten the market; it has redefined what "winning" looks like for the independent investor. Even investors with decades of experience are surprised at how fast their portfolio grows when it is powered by a precision-designed, high-performance CAGR engine that produces 45%+ per year.
Note: Even in its worst calendar year (2022), the strategy returned 3.21%, compared to the benchmark S&P 600's -16.20% that year.
Institutional Protection for the Individual Investor
The Achilles' heel of smallcap investing is often liquidity—getting in is easy, but getting out can be a nightmare. We’ve solved this. Every stock in this strategy is screened to ensure it can accommodate hundreds of investors simultaneously. You get the growth potential of a small company with the exit-path security of a much larger equity.
To protect the integrity of the returns for our existing users, we must strictly limit the number of active subscribers to this model. Once we hit that cap, the doors will close, and a waiting list will be established. It is open now, but you may wish to subscribe soon to be sure you get a spot with this portfolio.
Monthly
Easy-access monthly subscription. 14-day free trial. 60-day Satisfaction Guarantee.
$97
/month
Quarterly
Save 10% with a quarterly subscription. 14-day free trial. 60-day Satisfaction Guarantee.
$262
/quarter
-10% discount
Annually
Save 20% with an annual subscription. 14-day free trial. 60-day Satisfaction Guarantee.
$931
/year
-20% discount
Important Disclosures: For informational purposes only to demonstrate the effectiveness of systematic investment strategies. VitalQuant does not offer personalized investment advice. Neither Vital Quantitative Research, LLC (dba VitalQuant.com), nor its employees, service providers, associates, or affiliates are responsible for any losses you may incur as a result of using the information provided. Investing in publicly traded securities is inherently risky, and you may lose money. Past investment performance may not be indicative of future returns. All quantitative strategies developed by any provider must use simulated or hypothetical performance results in their creation, which have inherent limitations and do not represent actual trading. All VitalQuant Premium Strategies must have a minimum of five years of out-of-sample, live performance to be considered for our lineup of flagship investment strategies. The content herein may not be copied, reproduced, or distributed in any way. See all Terms and Conditions for use of this website.
VitalQuant provides individual investors with high-performance, institutional-grade investment strategy signals at an affordable price. Profit from models designed by Wall Street strategists today.
.svg)
.svg)
.svg)
.svg)